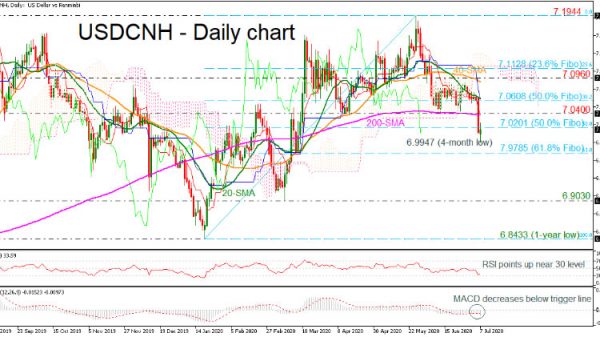
USDCNH plummeted to a fresh four-month low of 6.9947 earlier today after the strong bearish rally on Monday. The market is in the process to cover some of the losses, approaching the 50.0% Fibonacci retracement level of the up leg from 6.8433 to 7.1944 at 7.0201 again.
The momentum indicators are contradicting each other as the RSI is rebounding on the oversold region, while the MACD is declining beneath its trigger line in the near term. Also, the 20- and 40-day simple moving averages (SMAs) completed a bearish cross, while the 200-day SMA is flattening.
To the upside, an initial important resistance region from the 200-day SMA, which overlaps with 7.0400 could prove difficult to overrun. Conquering this, the 50.0% Fibonacci of 7.0608 could halt the climb towards the 40-day SMA and the 7.0930 resistance.
Otherwise, if sellers manage to retake control the 61.8% Fibonacci of 6.9785, this could deter the price from encountering the 6.9030 support level. Falling below this, the one-year low of 6.8433 may challenge bears’ efforts.
Overall, the bearish structure remains intact following the pullback from the May 27 peak at 7.1944.
 Signal2forex.com - Best Forex robots and signals


