XAG/USD continues to push higher. After yesterday’s move, in which the Silver ETF (SLV) was suspected of being the next target of a short squeeze, the move continues…and it is dragging Gold along for the ride. Precious metals are typically used as inflation hedges. As the US Dollar moves lower, it creates inflation, and thus, precious metals should move higher. It’s worth noting again (see yesterday’s article), that IF this is indeed a colluded short squeeze, and the US Dollar is falling because of it, it will affect the largest trading market in the world, the fx market! Central banks will not be happy.
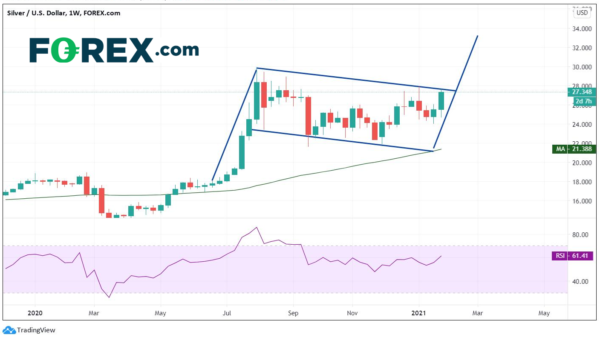
On a weekly timeframe, the XAG/USD in forming a flag pattern. If the precious metal does move higher and break above the top trendline of the flag near 27.65, it will be on its way towards its flag target near 33.25. It doesn’t matter whether it’s a short squeeze or a hedge against inflation, a move higher is a move higher. This would be an all-time new high.
Source: Tradingview, FOREX.com
On a 240-minute timeframe, XAG/USD has been in a symmetrical triangle since August 10th, 2020. Within the triangle, XAG/USD has moved from a recent low of 21.99 to 27.92. It then pulled back and held the 61.8% Fibonacci retracement of that move and ramped higher yesterday. XAG/USD is currently testing the upper trendline (the same one as the top of the flag pattern on the weekly) and the January 5th highs near 27.92. There is a resistance zone above between 28.50 and 29.50, dating back to August 2020. Horizontal support on the downside crosses near 26.00 and 24.70.
Source: Tradingview, FOREX.com
Gold, which has not been the target of a short squeeze, is being dragged higher with Silver. XAU/USD has been in a downward sloping channel since the all-time highs were made in early August. The precious metal posted a false breakout of the channel to 1959, only to fail and move back to the 200 Day Moving average, which is currently 1849.77.
Source: Tradingview, FOREX.com
On a shorter-term 240-minute timeframe, XAU/USD has broken above the downward sloping trendline from the highs of January 6th and is testing resistance and prior highs, as well as the 50% retracement level from the January 6th highs to the January 17th lows, near 1879. If price breaks above there, horizontal resistance and the 61.8% Fibonacci retracement level from the recently mentioned timeframe crosses near 1902. The next level of resistance is the January 6th highs at 1959. Support is back at the downward sloping trendline and the los of January 27th near 1827 and then the January 17th lows of 1802.7.
Source: Tradingview, FOREX.com
A quick glance at the Gold/Silver ratio shows that Gold has been underperforming vs Silver and it is currently breaking through horizontal support.
Source: Tradingview, FOREX.com
Traders need to be aware that if Silver is the current short squeeze target, it will affect the value of the US Dollar and, in general, the currency markets. As mentioned yesterday, Silver is not a stock, and central banks may not have as much patience as stock regulators if the US Dollar begins to move on a short squeeze!
 Signal2forex.com - Best Forex robots and signals


