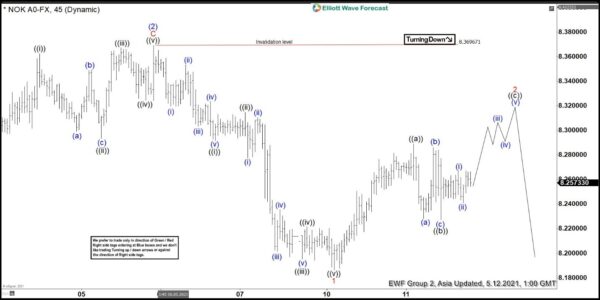
Short Term Elliott Wave structure for USDNOK suggests the decline from March 24, 2021 high is unfolding as a 5 waves impulse Elliott Wave structure. Down from March 24 high, wave (1) ended at 8.149 and bounce in wave (2) ended at 8.369. The 45 minutes chart below shows the wave (2) bounce and pair resumes lower from there in wave (3). The pair still needs to break below April 29 low at 8.144 to rule out a double correction in wave (2).
Down from wave (2), wave ((i)) ended at 8.291 and bounce in wave ((ii)) ended at 8.3144. Pair resumed lower in wave ((iii)) towards 8.195, wave ((iv)) ended at 8.221 and wave ((v)) ended at 8.186. This also completed wave 1 of (3) in higher degree. Bounce in wave 2 is now in progress to correct cycle from May 6, 2021 high (8.369) as a zigzag Elliott Wave structure before pair resumes lower.
Potential target higher in wave ((c)) of 2 is 100% – 123.6% Fibonacci extension of wave ((a)) which comes at 8.32 – 8.342 area where sellers should appear for further downside or 3 waves pullback at least.
USDNOK 45 Minutes Elliott Wave Chart
 Signal2forex.com - Best Forex robots and signals


