- GOLD Trades lower with in bullish triangle.
- Above trendline support seems bullish.
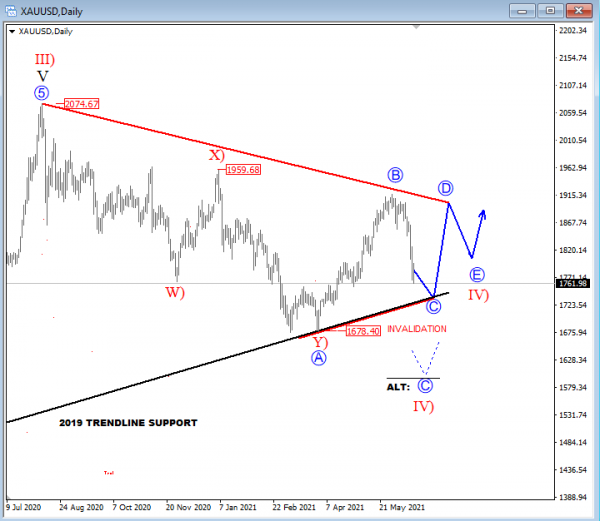
As per Elliott Wave analysis Gold (XAUUSD) is coming down quite sharply, but we still believe bulls are still here, so for now we are observing wave C of a potential bullish triangle formation if it manages to stay above strong 2019 trendline support.
However, because of a strong fall, be aware of a bigger and more complex decline, especially if we don’t see rebound and recovery here in the 17xx zone.
Gold daily Elliott Wave analysis chart
 Signal2forex.com - Best Forex robots and signals


