
📑 Table of Contents
- 1. What Are Retail Sales?
- 2. How Are Retail Sales Measured?
- 3. Why Do Retail Sales Matter to Traders?
- 4. Retail Sales and the Forex Market
- 5. Retail Sales and the Stock Market
- 6. How to Trade Retail Sales Data
- 7. Historical Retail Sales Data
- 8. Retail Sales vs Other Economic Indicators
- 9. Common Mistakes When Trading Retail Sales
- 10. Frequently Asked Questions
1. What Are Retail Sales?
Retail sales refer to the total receipts from retail stores and online retailers, measuring consumer spending on goods and services. It is one of the most closely watched economic indicators because it provides a real‑time snapshot of consumer behaviour — which accounts for roughly two‑thirds of GDP in most developed economies. Strong retail sales figures typically signal a healthy economy, while weak figures can indicate economic slowdown.
The Retail Sales Index (RSI) is the formal name for the report that aggregates retail sales data over a month‑long period. The construction of the index varies from country to country, but the core principle remains the same: tracking how much consumers are spending at retail establishments. In the United States, the data is released monthly by the U.S. Census Bureau, typically around the 13th of each month.
Retail Sales Definition
Retail sales measure the total value of all sales of goods and services by retail establishments. This includes everything from groceries and clothing to electronics, cars, and online purchases. The data is collected from a sample of retail businesses across the country and is used to gauge consumer spending trends.
The Retail Sales Index (RSI) Explained
The Retail Sales Index (RSI) is the aggregated measure of retail sales data. It serves as a leading economic indicator because consumer spending is the primary driver of economic activity. When the RSI rises, it suggests that consumers are confident and spending freely, which stimulates business activity, employment, and investment. When it falls, it can signal economic headwinds.
Core Retail Sales vs Headline Retail Sales
In the United States, the major component of the retail sales figure is auto dealers, which is why the Census Bureau report contains a “Retail Sales Ex Autos” and “Retail Sales Ex Gas/Autos” to eliminate potential irregularity (volatility) from the auto industry – this exclusion is also referred to as Core Retail Sales in some instances. Core retail sales provide a clearer picture of underlying consumer spending trends by removing the most volatile components.

2. How Are Retail Sales Measured?
The retail sales index is constructed from a comprehensive survey of retail establishments. In the U.S., the Census Bureau collects data from a sample of retailers across the country and weights the categories based on their contribution to total sales.
US Census Bureau Categories
The U.S. retail sales index comprises various retailer types as shown below (Source: U.S. Census Bureau):
- Motor vehicle and parts dealers
- Furniture and home furniture stores
- Electronics and appliance stores
- Building material, garden equipment & supplies dealers
- Food and beverage stores
- Health and personal care stores
- Gasoline stations
- Clothing and clothing accessories stores
- Sporting goods, hobby, musical instrument & book stores
- General merchandise stores
- Miscellaneous store retailers
- Non‑store retailers (online)
- Food services & drinking places
The above categories are then weighted using a sampling frame predefined by the U.S. Census Bureau and are subject to periodic changes.
Weighting and Sampling Methodology
The Census Bureau uses a stratified sampling methodology to ensure the data is representative of the entire retail sector. Each category is assigned a weight based on its share of total retail sales, and the data is seasonally adjusted to account for predictable fluctuations.
International Variations
Different countries construct their retail sales indices differently. While the U.S. focuses heavily on the auto sector, other countries may place more emphasis on different categories depending on their economic structure.
3. Why Do Retail Sales Matter to Traders?
Consumer spending is a key metric that drives economic activity, so monitoring this data is essential for a company’s wellbeing as well as decision making (monetary and fiscal) going forward. For traders, retail sales data is invaluable because it provides early signals about the health of the economy and the likely direction of monetary policy.
The Link to Economic Growth (GDP)
Retail sales account for roughly two‑thirds of GDP growth. When spending increases, business activity increases thus stimulating the economy and driving foreign investment. This in turn impacts other key economic components such as durable goods orders, consumer confidence, balance of trade, GDP and inflation.
Retail Sales and Inflation
Positive retail sales data cannot always be taken at face value as the figure produced by the RSI is not adjusted for inflation. A positive figure once adjusted for CPI inflation can result in a net drop in retail sales. When inflation is high, the per dollar expenditure is reduced in terms of purchasing power, which is why factoring in inflation is important for an all-inclusive representation of the economy.
Impact on Monetary Policy and Interest Rates
Retail sales can have an influential impact on the central bank’s (Federal Reserve) decision‑making process. For example, if retail sales are slowing, the economic outlook may be considered bleak which may prompt the Fed to loosen monetary policy by cutting interest rates in hopes of stimulating the economy – the opposite will apply if retail sales are growing.
4. Retail Sales and the Forex Market
As a general rule of thumb, improved retail sales usually translates to a positive for the home currency in question, while also adding to market volatility pre and post release.
How Retail Sales Affect Currency Values
Retail sales data directly impacts currency values, particularly the US dollar. Strong retail sales suggest a robust economy, which can lead to central bank rate hikes, strengthening the currency. Conversely, weak retail sales can lead to rate cuts and currency depreciation.
USD Impact — Historical Patterns
Supporting this positive correlation between currency and retail sales, the chart below shows a 6‑month snapshot between U.S. retail sales data and the Dollar Index (DXY). There is a clear positive association between the two variables but as with all financial market analysis, there are always other factors at play.
Best Currency Pairs to Trade Around Retail Sales
USD pairs are most affected, particularly EUR/USD, GBP/USD, and USD/JPY. Strong retail sales typically strengthen the USD against major currencies.

5. Retail Sales and the Stock Market
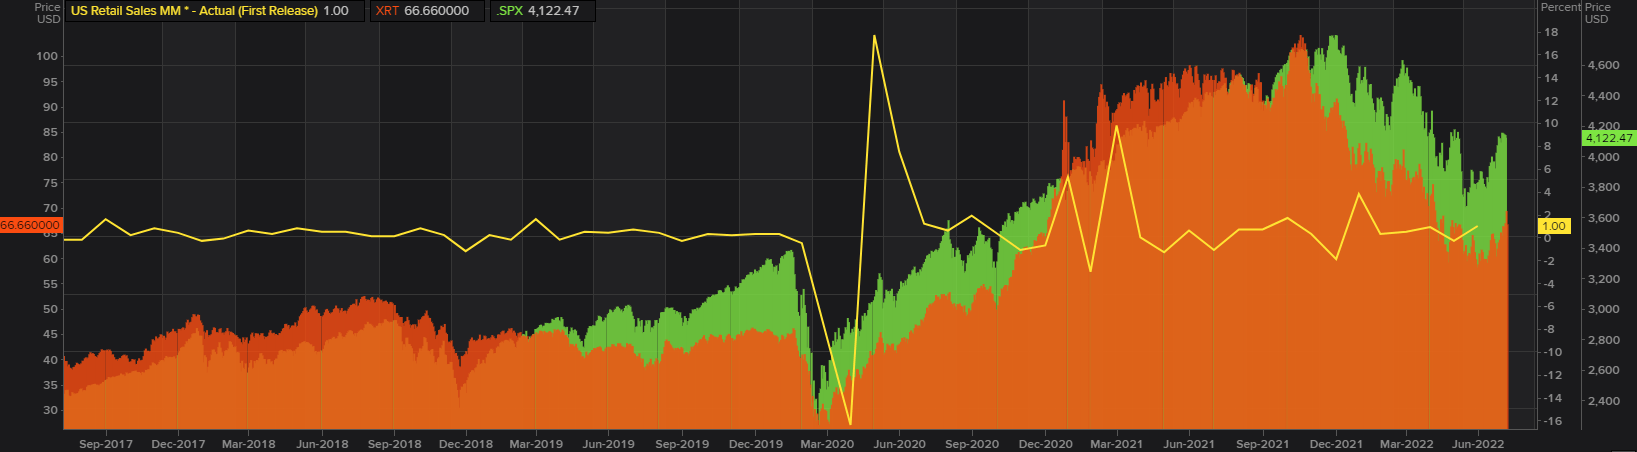
Retail sales traditionally exhibits a positive correlation to stocks because an increase in sales lends itself to higher company earnings. The graphic below shows how the U.S. equity markets (SPX) largely track fluctuations in retail sales data with an expected higher parallel with the retail sector as measured by the SPDR Retail ETF.
Correlation with Equities
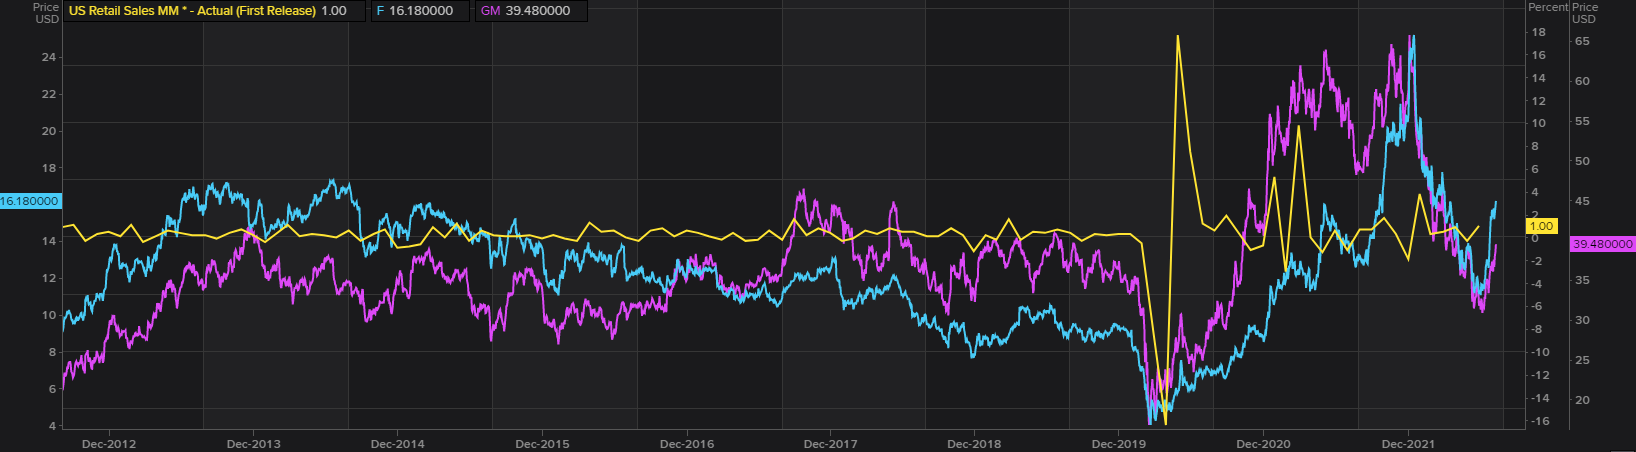
Strong retail sales support stock prices, particularly in the consumer discretionary and retail sectors. The automotive industry, for example, can be tracked through the motor vehicle sub‑category. The chart below outlines the rapport between the two variables by highlighting the positive correlation between retail sales data and two class‑leading manufacturers in Ford Motor Company and General Motors Company respectively.
Retail Sector ETFs and Retail Sales
Investors following the automotive industry can take clues from the motor vehicle sub‑category as to the current state and short‑term outlook for local automotive manufacturers. The same logic can be extended through to the other sub‑categories and utilized as an input for stock analysis in those corresponding fields.
6. How to Trade Retail Sales Data
Trading retail sales is by no means straightforward but there are a few historical and noteworthy relationships between RSI and other markets. Here is a practical framework for trading retail sales data.
Pre-Release Preparation
- Check the consensus forecast — know what the market is expecting. The deviation from expectations determines the market reaction.
- Mark key levels — identify support and resistance levels on your chosen currency pair or index.
- Set alerts — use your trading platform to set price alerts for key levels.
Trading the Initial Reaction
- Wait 1‑2 minutes after the release — let the dust settle and avoid the initial chaotic spike.
- Watch for the deviation — compare the actual figure against the consensus forecast.
- Look for technical confirmation — support/resistance breaks, candlestick patterns, or indicator signals.
Post-Release Strategies
- Entry on pullback — wait for a retracement to a key level before entering.
- Set stop‑loss — place beyond the initial spike to avoid being stopped out by volatility.
- Target previous highs/lows — or Fibonacci extension levels for profit targets.
- Maintain a 1:2+ risk‑reward ratio — ensure your potential reward justifies the risk.
7. Historical Retail Sales Data — Key Statistics
The table below shows recent US retail sales data and market reactions, helping traders understand typical patterns.
| Month | Headline Retail Sales (MoM) | Core Retail Sales (MoM) | Market Reaction (USD) |
|---|---|---|---|
| May 2026 | +0.4% | +0.3% | Mildly positive |
| April 2026 | +0.5% | +0.4% | Positive |
| March 2026 | +0.3% | +0.3% | Neutral |
| February 2026 | +0.6% | +0.5% | Strongly positive |
| January 2026 | +0.2% | +0.2% | Mildly negative |
📌 Data is based on estimates. Actual figures may vary. Always check the latest release for current numbers.
8. Retail Sales vs Other Economic Indicators
| Indicator | Relationship with Retail Sales | Impact on Markets |
|---|---|---|
| GDP | Retail sales is a leading indicator of GDP growth | Strong retail sales → GDP growth |
| Inflation (CPI) | Retail sales not inflation‑adjusted; higher prices can inflate sales | High inflation → real sales may fall |
| Consumer Confidence | Correlated; confident consumers spend more | Rising confidence → higher sales |
| Durable Goods Orders | Lagging indicator; follows retail sales | Strong sales → more orders |
| Interest Rates | Central banks monitor retail sales for policy decisions | Strong sales → potential rate hikes |
📌 Retail sales is a leading indicator that provides early signals about the direction of other economic metrics.
9. Common Mistakes When Trading Retail Sales
| Mistake | Why It’s Harmful | How to Fix |
|---|---|---|
| Trading the initial spike | Extreme volatility, slippage | Wait 1‑2 minutes for calm |
| Ignoring inflation adjustment | Nominal vs real sales misread | Always check inflation context |
| Ignoring the consensus forecast | Misses the deviation | Always know expectations |
| Trading against the broader trend | Fundamental bias mismatches | Check overall trend first |
| Over-leveraging on retail sales | High volatility can blow up accounts | Reduce position size |
📌 The most common cause of losses when trading retail sales is not having a clear plan and risking too much on a single data release.
10. Frequently Asked Questions
What are retail sales in economics?
Retail sales are the total receipts from retail stores and online retailers, measuring consumer spending on goods and services. It is a key economic indicator that reflects the health of the consumer sector and the broader economy.
What is the Retail Sales Index (RSI)?
The Retail Sales Index (RSI) is an economic indicator that measures the aggregate sales of retail goods and services over a specific period. It provides insights into consumer spending patterns and economic activity.
Why are retail sales important to traders?
Retail sales are a leading indicator of economic growth. Strong retail sales suggest a healthy economy, which can strengthen the currency (especially USD) and boost stock markets. Weak retail sales can signal economic slowdown.
How do retail sales affect the forex market?
Retail sales data directly impacts currency values, particularly the US dollar. Strong retail sales suggest a strong economy and can lead to central bank rate hikes, strengthening the currency. Weak sales can lead to rate cuts and currency depreciation.
What is the difference between headline and core retail sales?
Headline retail sales include all categories, including auto sales and gas stations. Core retail sales exclude these volatile components (auto and gas) to provide a clearer picture of underlying consumer spending trends.
How do retail sales affect inflation?
Retail sales are not adjusted for inflation. When inflation is high, the purchasing power of each dollar decreases, which can result in a net drop in real retail sales even if nominal figures are positive.
When is retail sales data released?
In the US, retail sales data is released monthly by the Census Bureau, typically around the 13th of each month. The report includes data from the previous month.
What is the relationship between retail sales and GDP?
Retail sales account for roughly two-thirds of GDP growth. As a leading indicator, retail sales provide early signals about the direction of GDP and the broader economy.
How should I trade retail sales data?
Check the consensus forecast, wait for the initial volatility to settle, look for technical confirmation (support/resistance), and enter with a defined stop-loss. Use a 1:2 risk‑reward ratio minimum.
What currency pairs are most affected by retail sales?
USD pairs are most affected, particularly EUR/USD, GBP/USD, and USD/JPY. Strong retail sales typically strengthen the USD against major currencies.
What is the correlation between retail sales and the stock market?
Retail sales traditionally exhibits a positive correlation to stocks because an increase in sales lends itself to higher company earnings.
How does retail sales impact central bank policy?
Central banks monitor retail sales to assess consumer spending and economic momentum. Strong retail sales can lead to hawkish monetary policy (rate hikes), while weak sales can lead to dovish policy (rate cuts).
📈 Combine Economic Data with Technical Confirmation: Retail sales data can trigger significant price moves. To refine your entry timing around these releases, master the Bullish Engulfing Candlestick Pattern — a powerful reversal signal that frequently appears after major economic data releases, helping you confirm the direction of the move with greater precision.
📊 Put Retail Sales Analysis into Action: Understanding economic indicators is essential, but putting that knowledge into practice is what builds profits. See how professional traders approach the markets with Your First Trade for Friday — a practical example of how to combine economic data reading with technical analysis to make informed trading decisions.



 Signal2forex.com - Best Forex robots and signals


