

📑 Table of Contents
- 1. What Is a Bull Market?
- 2. What Is a Bear Market?
- 3. Key Differences Between Bull and Bear Markets
- 4. How to Identify a Bull or Bear Market Using Technical Analysis
- 5. Technical Indicators Reference Table
- 6. Fundamental Factors That Signal Market Turns
- 7. Market Sentiment as a Key Driver
- 8. Bull Market vs Bear Market Trading Strategies
- 9. The Four Phases of Market Cycles
- 10. Real Trading Example — Identifying a Market Turn
- 11. Frequently Asked Questions
1. What Is a Bull Market?
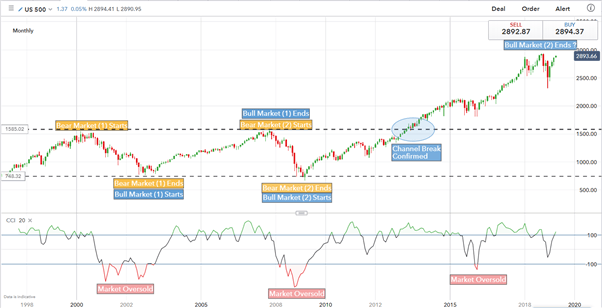
Bull markets are characterised by rising prices, ongoing positive sentiment and a positive economic backdrop. A common metric used to define a bull market is when the price of an asset has moved 20% higher from its recent, significant low. Bull markets can last for months or even years.
During a bull market, investor confidence is high, economic indicators are generally positive, and there is a widespread belief that the upward trend will continue. This environment attracts new investors who want to participate in the gains, further fuelling the upward momentum.

2. What Is a Bear Market?
A bear market is diametrically opposite to a bull market and is characterised by falling prices, low or negative sentiment and, normally, a weakening economic backdrop. Bear markets can produce violent price swings and moves can also last for months or years — though they tend to unfold more quickly than their counterpart.
In a bear market, fear and pessimism dominate. Investors rush to sell positions, protect capital, and reduce risk. Short-sellers often enter the market to profit from falling prices, which can accelerate the downward spiral.

3. Key Differences Between Bull and Bear Markets
Understanding the differences between bull and bear markets is essential for developing effective trading strategies. The table below provides a clear comparison.
| Feature | Bull Market | Bear Market |
|---|---|---|
| Price Direction | Rising prices | Falling prices |
| Market Sentiment | Optimistic, positive | Pessimistic, negative |
| Economic Backdrop | Growing economy | Weakening economy |
| Investor Behavior | Buying, greed | Selling, fear |
| Volatility | Lower | Higher |
| Duration | Months to years | Months to years (often shorter) |
| 20% Rule | 20% above recent low | 20% below recent high |
| Trading Strategy | Buy dips, follow momentum | Short selling, hedging |
| Risk Level | Lower | Higher |
📌 Duration refers to typical market cycle lengths. Risk Level reflects the relative difficulty and uncertainty of trading in each market condition.

4. How to Identify a Bull or Bear Market Using Technical Analysis
Technical analysis offers several tools to help traders identify the current market direction. Professional traders have long been using these indicators to determine if they are in a bull move or a bear market.
Moving Averages
When the price is trading above both the 50-day and 200-day moving averages, it is generally considered a sign of a bull market. A golden cross (50-day MA crossing above the 200-day MA) is a widely followed bullish signal. Conversely, when the price trades below both moving averages, it suggests a bear market. A death cross (50-day MA crossing below the 200-day MA) signals bearish conditions.
Trendlines
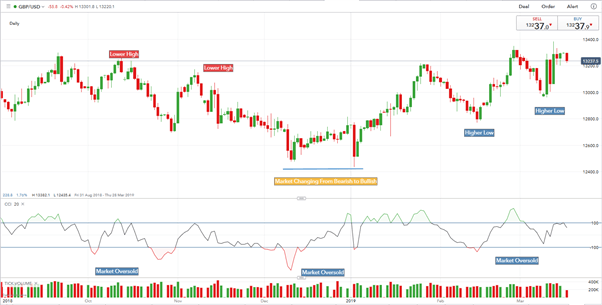
Higher highs and higher lows define an uptrend (bull market). Lower highs and lower lows define a downtrend (bear market). Drawing trendlines on price charts is one of the simplest and most effective ways to visualise market direction.
RSI (Relative Strength Index)
The RSI measures the speed and change of price movements. In a bull market, RSI tends to remain above 50 and often reaches overbought territory (70+). In a bear market, RSI stays below 50 and often reaches oversold territory (30-).
MACD (Moving Average Convergence Divergence)
A bullish crossover (MACD line crossing above the signal line) suggests upward momentum. A bearish crossover (MACD line crossing below the signal line) suggests downward momentum.
Volume Analysis
Increasing volume on up moves confirms buying interest and supports a bull market. Increasing volume on down moves confirms selling pressure and supports a bear market.
💡 Trading tip: No single indicator should be used in isolation. The most reliable signals come from confluence — multiple indicators pointing in the same direction.

5. Technical Indicators Reference Table
This static reference table provides a quick guide to interpreting key technical indicators for market direction.
| Indicator | Bullish Signal | Bearish Signal |
|---|---|---|
| Moving Averages (50 & 200) | Price above both, golden cross | Price below both, death cross |
| RSI (Relative Strength Index) | Above 50, trending to 70+ | Below 50, trending to 30- |
| MACD | Bullish crossover (above signal line) | Bearish crossover (below signal line) |
| Trendlines | Higher highs and higher lows | Lower highs and lower lows |
| Volume | Increasing on up moves | Increasing on down moves |
| Support/Resistance | Breaking resistance levels | Breaking support levels |
📌 Bullish Signal indicates conditions that suggest a bull market. Bearish Signal indicates conditions that suggest a bear market. Always use multiple indicators for confirmation.

6. Fundamental Factors That Signal Market Turns
Fundamental analysis helps traders paint a contemporary landscape of a financial market, allowing them to then ‘dig down’ using other analytical tools and techniques.
Central Bank Policy
The role of a central bank is crucial in modern financial markets and they should be followed closely to determine the current state of the economy and the future path of interest rates. When a central bank shifts from hawkish to dovish policy — or vice versa — it often signals a significant market turn.
Economic Data
Key economic indicators such as GDP growth, employment figures, inflation data (CPI), and manufacturing PMIs provide crucial clues about the health of the economy. Strong economic data typically supports a bull market, while weak data can signal the start of a bear market.
Geopolitical Events
The political landscape needs to be factored in, along with any trade disruptions or disputes both internally and with external partners. Elections, trade wars, and geopolitical tensions can dramatically shift market sentiment and trigger market turns.
💡 Trading tip: Macro-fundamental shifts normally signal market shifts. Pay close attention to central bank communications and key economic releases.
7. Market Sentiment as a Key Driver
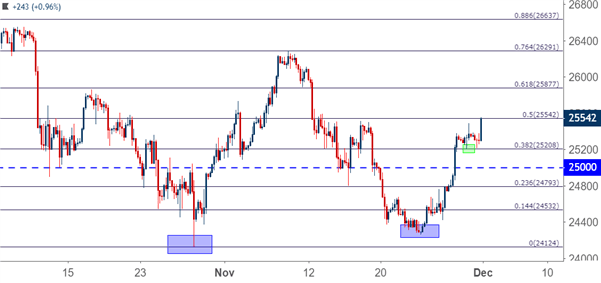
Market sentiment has a very important role to play when deciding if an asset class is on the cusp of a turn or not. Sentiment is seen as the overall market tone with an optimistic, positive sentiment a driver of a bull market, while a negative or pessimistic market bias will normally see prices driven lower.
“Greed” and “fear” are the extremes of the spectrum, with a bull market drawing in investors who look to jump on the trend, while a bear market rife with those clamoring to cut risk will also attract short-sellers who look to profit from falling prices.
Positive sentiment helps fuel a bull market and negative sentiment helps fuel a bear market. Understanding these psychological drivers can give traders an edge in identifying market turns before they happen.
8. Bull Market vs Bear Market Trading Strategies
Each market condition requires a different approach. Traders should know how to confidently approach, enter and exit both bull or bear markets.
How to Trade a Bull Move
- Buy the dips: In a bull market, pullbacks to support levels are buying opportunities.
- Follow the trend: Use moving averages and trendlines to stay with the upward momentum.
- Breakout trading: Enter when price breaks above key resistance levels with strong volume.
- Momentum strategies: Focus on strong-performing assets and sectors.
How to Trade a Bear Market
- Short selling: Profit from falling prices by selling assets you don’t own.
- Hedging strategies: Use options or inverse ETFs to protect your portfolio.
- Defensive positioning: Move capital into safe-haven assets like gold or government bonds.
- Wait for reversals: Look for exhaustion gaps and reversal patterns before entering long positions.
Risk Management in Both Markets
- Position size: Never risk more than 1–2% of your account on a single trade.
- Stop-loss discipline: Always use stop-loss orders to protect your capital.
- Diversification: Spread your risk across different assets and strategies.
- Adaptability: Be prepared to change your strategy as market conditions shift.
9. The Four Phases of Market Cycles
Markets move in cycles. Understanding these four phases can help traders anticipate when a bull move or bear market is approaching.
- Phase 1 — Accumulation: Smart money begins buying after a prolonged downtrend. Prices stabilise and start to form a base.
- Phase 2 — Markup (Bull Market): Prices break out of the accumulation phase. Optimism grows, and more investors participate. This is the bull move that traders love.
- Phase 3 — Distribution: Smart money begins selling into strength. Prices become volatile, and sentiment starts to shift.
- Phase 4 — Decline (Bear Market): Prices break down from the distribution phase. Fear and pessimism take over. This is the bear market.
💡 Trading tip: The ability to identify when the market is changing from one bias to the other can put you in a position to benefit from a market that is moving either up or down.
10. Real Trading Example — Identifying a Market Turn
Let’s walk through a realistic example of identifying a market turn using the tools discussed above.
Scenario: Gold (XAUUSD) has been in a strong downtrend, making lower lows and lower highs. However, several warning signs suggest a potential turn is approaching.
Signals of a Potential Bull Move:
- Technical: RSI reaches oversold territory (below 30) and shows bullish divergence — price makes a lower low but RSI makes a higher low.
- Fundamental: The Federal Reserve signals a pause in rate hikes, weakening the US dollar.
- Sentiment: Investor fear reaches extreme levels (high put/call ratio), suggesting capitulation.
- Price Action: A piercing line or bullish engulfing pattern forms at a key support level.
Trade Setup:
- Entry: Buy on confirmation of the reversal (e.g., bullish candle close above resistance).
- Stop-Loss: Place stop-loss below the recent low.
- Take-Profit: Target previous swing highs or Fibonacci extension levels.
- Risk-Reward: Aim for a minimum 1:2 risk-reward ratio.
In this example, patience and using multiple confirmation signals significantly improved the probability of a successful trade.
11. Frequently Asked Questions
What is a bull market?
A bull market is characterised by rising prices, ongoing positive sentiment and a positive economic backdrop. A common metric used to define a bull market is when the price of an asset has moved 20% higher from its recent, significant low. Bull markets can last for months or even years.
What is a bear market?
A bear market is characterised by falling prices, low or negative sentiment and, normally, a weakening economic backdrop. Bear markets can produce violent price swings and moves can also last for months or years — though they tend to unfold more quickly.
How do you determine if it’s a bull or bear market?
Use a combination of technical analysis (moving averages, trendlines, RSI, MACD), fundamental analysis (economic data, central bank policy), and market sentiment (investor optimism or pessimism) to determine the market direction.
What is the 20% rule for bull and bear markets?
A bull market is typically defined as a 20% rise from a recent low, while a bear market is defined as a 20% decline from a recent high. These are widely used thresholds in the financial industry.
What are the key differences between bull and bear markets?
Bull markets feature rising prices, optimism, and economic growth. Bear markets feature falling prices, pessimism, and economic contraction. Bear markets tend to be more volatile and often shorter in duration.
What technical indicators help identify market direction?
Key indicators include moving averages (price above/below), RSI (above/below 50), MACD (crossover signals), trendlines (higher highs/lower highs), and volume analysis (increasing on trend direction).
What trading strategies work in bull and bear markets?
In bull markets, traders focus on momentum, breakouts, and buying dips. In bear markets, traders look for short-selling opportunities, hedging strategies, and defensive positions.
How long do bull and bear markets typically last?
Bull markets tend to last longer than bear markets, often several years. Bear markets are typically shorter and more volatile, lasting months rather than years.
🏦 Understand the power behind market moves: Learn how central bank intervention in the foreign exchange market can trigger sudden market turns — essential knowledge for identifying when a bull move or bear market is being artificially influenced.
🤖 Automate your trading in any market condition: Discover the best forex robot — a fully automated trading solution that adapts to bull and bear markets, removing emotion and trading with precision 24/7.
📞 Need help identifying market direction? Our team is here to assist you. Visit our Contact Page or use the online chat available on every page of our website for immediate support.



 Signal2forex.com - Best Forex robots and signals


