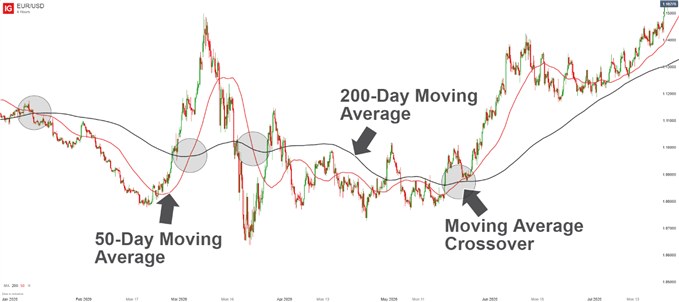
Moving Average Crossovers
When traders begin to study thetechnical analysis of price action, they will often be introduced to moving averages, which can be helpful in forecasting future price trends. Once traders understand moving averages, they can then apply two moving averages to...
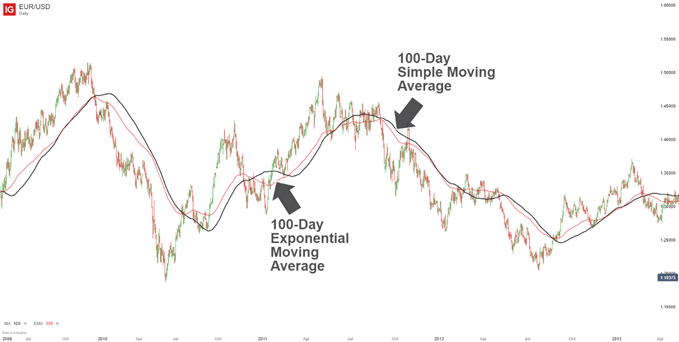
Simple Moving Average (SMA) vs Exponential Moving Average (EMA)
When considering the technical analysis tools to use in their charts, traders will frequently come by simple moving averages, or SMAs, and exponential moving averages, or EMAs. Both of these instruments can help market practitioners make sense of price and...

Getting Started with Moving Averages
Moving Average Talking Points: The moving average is a simple indicator that can serve traders’ needs in a variety of ways. We introduced moving averages in the Technical Analysis Tools section; in this module dedicated to the indicator, we get...

The Most Volatile Currency Pairs and How to Trade Them
FX markets are susceptible to a range of factors which affect their volatility, and many traders look to tailor their strategies to capitalize on the most volatile currency pairs. Currency volatility, often measured by calculating the standard deviation or variance...
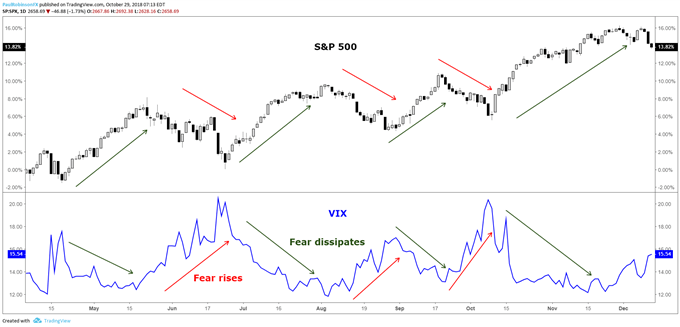
What is the VIX? A Guide to the S&P 500 Volatility Index
S&P 500 Volatility Index: An introduction Traders should keep a close eye on the ‘VIX’, or CBOE Volatility Index, when trading major indices like the S&P 500. The S&P 500 VIX correlation is a primary example of why the relationship...
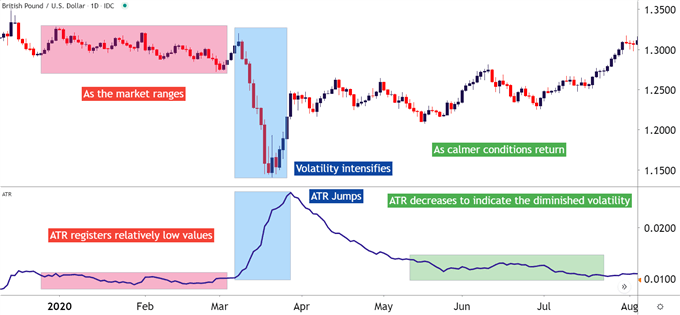
How to Measure Volatility with Average True Range (ATR)
MEASURING VOLATILITY: TALKING POINTS Volatility is the measurement of price variations over a specified period of time. We discuss the Average True Range indicator (ATR) as a measurement of volatility. Technical Analysis can bring a significant amount of value to...
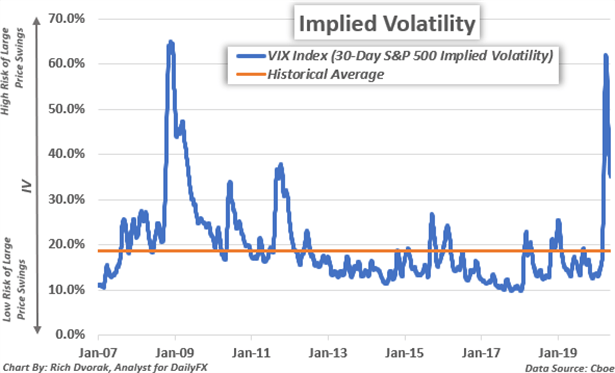
Implied Volatility: What it is & Why Traders Should Care
Implied volatility, synonymous with expected volatility, is a variable that shows the degree of movement expected for a given market or security. Often labeled as IV for short, implied volatility quantifies the anticipated magnitude, or size, of a move in...
Historical Volatility: A Timeline of the Biggest Volatility Cycles
Throughout history there have been a number of extremely meaningful volatility spikes across major financial markets. Each had defining characteristics that made them similar, despite occurring in very different markets and for different reasons. The continuity seen across these volatility...
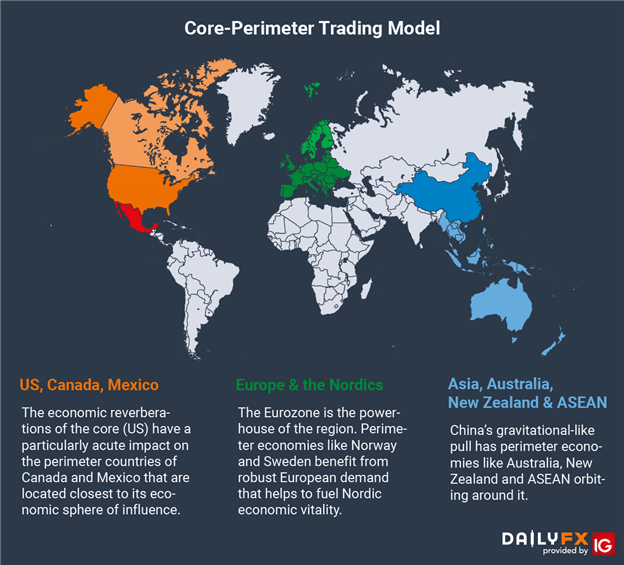
Core-Perimeter Trading Model: US, Eurozone & China
Core-Perimeter Trading Model Three economic powerhouses are the primary drivers of the global economy: the US, China and EU. Surrounding each of these growth nodes are perimeter economies that strongly rely on the performance of the core. These are typically...

How AUD & NZD Exchange Rates Are Impacted by China’s Economy
AUD and NZD Analysis, China Trade Relations With Australia and New Zealand, Understanding the Core-Perimeter Model -TALKING POINTS: How to trade the Australian and New Zealand Dollars with regard to China’s growth What are the economic and trade relations between...

 Signal2forex.com - Best Forex robots and signals


