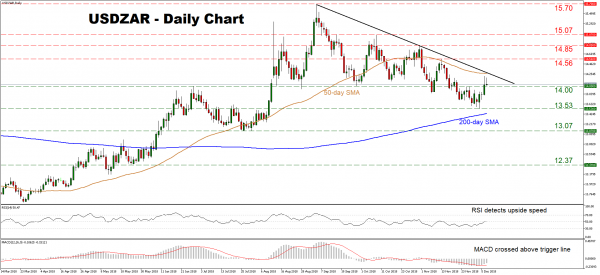
USDZAR continues to print lower lows and lower highs on the daily chart below a downtrend line drawn from the highs of September 6. Hence, the broader picture remains negative for now. For it to turn neutral, it would require a clear close above the crossroads of the downtrend line, the 50-day SMA, and the 14.56 level.
Short-term momentum oscillators, though, suggest the latest bounce may continue for a while. The RSI just pierced above its neutral 50 line, while the MACD crossed above its red trigger line.
Further advances may find immediate resistance near the aforementioned crossroads. A decisive close above it would shift the bias to flat, setting the stage for a test of the October 31 high of 14.85, before the October 9 peak of 15.07 comes into view.
On the downside, a first wave of support to declines may come around the 14.00 handle, marked by the inside swing high on November 28. A bearish break may open the way for 13.53, the December 4 trough. Notice that the 200-day SMA at 13.42 lies not far below. Lower still, buy orders may be found near the July lows of 13.07.
Recapping, the overall picture is still negative; a break above 14.56 is required to turn it neutral.
 Signal2forex.com - Best Forex robots and signals


