
📑 Table of Contents
- 1. What Is a Hammer Candlestick?
- 2. Hammer vs Hanging Man — The Uptrend vs Downtrend Difference
- 3. How to Identify a Hammer Candlestick
- 4. Inverted Hammer Candlestick
- 5. Hammer Candlestick Trading Strategy — Step by Step
- 6. Hammer Candlestick Trading Checklist
- 7. How Reliable Is the Hammer Candlestick Pattern?
- 8. Common Mistakes When Trading Hammer Patterns
- 9. Frequently Asked Questions
1. What Is a Hammer Candlestick?
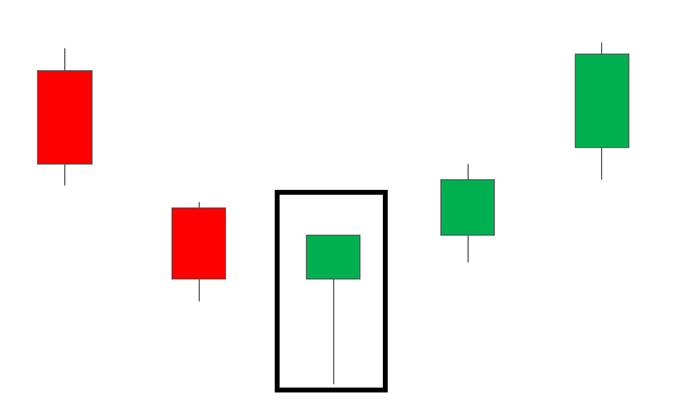
A hammer candlestick is a single-candle bullish reversal pattern that forms at the bottom of a downtrend. It signals that buyers are stepping in and a potential reversal to the upside is likely. The pattern is characterised by a small real body, a long lower wick (at least twice the length of the body), and little to no upper wick.
The hammer is widely regarded as one of the most reliable reversal patterns in technical analysis. It has been studied and traded for decades across all financial markets, including forex, stocks, indices, and commodities.
When a hammer-shaped candlestick appears in an uptrend, it is not called a hammer — it is called a Hanging Man. While the visual appearance is identical, the context is completely different. A Hanging Man signals a potential bearish reversal at the end of an uptrend.
2. Hammer vs Hanging Man — The Uptrend vs Downtrend Difference
Understanding the difference between a hammer and a hanging man is essential for accurate identification and trading. The visual appearance is identical — the difference is purely based on the market context.
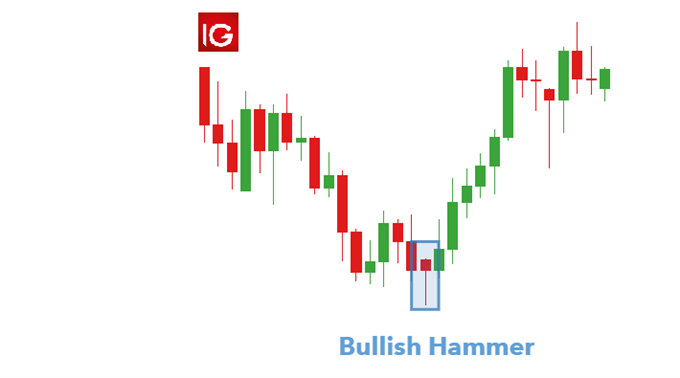
Hammer in a Downtrend (Bullish Reversal): A hammer forms at the bottom of a downtrend and signals a potential reversal to the upside. It indicates that sellers pushed prices lower but buyers stepped in and pushed prices back up, closing near the high of the session.
Hammer in an Uptrend (Hanging Man — Bearish Reversal): When a hammer-shaped candlestick appears in an uptrend, it is called a Hanging Man. It signals a potential bearish reversal to the downside. It indicates that buyers pushed prices higher but sellers stepped in and pushed prices back down.
💡 Trading tip: The context is everything. Always look at the preceding trend before identifying a hammer or hanging man pattern.
| Feature | Hammer (Downtrend) | Hanging Man (Uptrend) |
|---|---|---|
| Market Context | End of a downtrend | End of an uptrend |
| Signal | Bullish reversal | Bearish reversal |
| Appearance | Long lower wick, small body | Long lower wick, small body |
| Volume | Increasing on hammer | Increasing on hanging man |
| Confirmation | Next candle closes higher | Next candle closes lower |
| Entry | Buy above hammer high | Sell below hanging man low |
| Stop-Loss | Below hammer low | Above hanging man high |
| Success Rate | ~62-76% | ~55-69% |
📌 Success Rate is based on historical performance when confirmed with additional indicators. Higher timeframes (daily, weekly) tend to be more reliable.

3. How to Identify a Hammer Candlestick
Identifying a hammer candlestick requires a systematic approach. Use the following characteristics and checklist to confirm the pattern.
Key Characteristics of a Hammer Candlestick
- Market Context: The pattern must form after a clear downtrend (for hammer) or uptrend (for hanging man).
- Small Real Body: The body should be small, located at the upper end of the trading range.
- Long Lower Wick: The lower wick should be at least twice the length of the body.
- Minimal Upper Wick: Little to no upper wick.
- Volume: Increasing volume on the hammer candle strengthens the signal.
- Confirmation: The next candle should close in the direction of the reversal.
Hammer Candlestick Checklist
- ✅ Identify existing trend (downtrend for hammer, uptrend for hanging man)
- ✅ Look for a small real body at the upper end of the range
- ✅ Ensure the lower wick is at least twice the length of the body
- ✅ Confirm minimal or no upper wick
- ✅ Check for increasing volume on the candle
- ✅ Wait for confirmation from the next candle
4. Inverted Hammer Candlestick
The inverted hammer is a bullish reversal pattern that forms during a downtrend. It has a long upper wick, a small real body, and little to no lower wick. It indicates that buyers pushed prices higher before sellers brought them back down.
While the inverted hammer is not as widely discussed as the standard hammer, it is a powerful reversal signal when confirmed by the next candle closing higher.
5. Hammer Candlestick Trading Strategy — Step by Step
Trading the hammer candlestick pattern requires a disciplined approach. Follow these five steps to maximise your chances of success.
Step 1 — Identify a Valid Hammer Pattern
- Ensure the pattern forms after a clear downtrend.
- Confirm the small real body, long lower wick, and minimal upper wick.
- Verify the lower wick is at least twice the length of the body.
Step 2 — Wait for Confirmation
- Wait for the next candle to close higher than the hammer’s close.
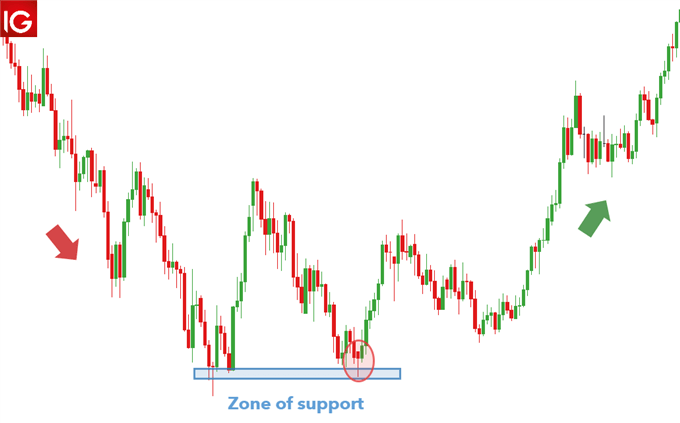
- Look for additional confirmation from RSI, MACD, or support/resistance levels.
- An RSI oversold reading (below 30) strengthens the signal.
Step 3 — Entry Rules
- Entry Signal: Enter a long position on a break above the high of the hammer candle.
- Alternative Entry: Some traders enter on the close of the confirmation candle.
- Confirmation: Wait for the next candle to close above the hammer’s high for additional confirmation.
Step 4 — Stop-Loss Placement
- Stop-Loss Placement: Place your stop-loss below the low of the hammer candle.
- Buffer: Add a small buffer below the low to account for market noise.
- Risk Management: Never risk more than 1–2% of your trading account on a single trade.
Step 5 — Take-Profit Targets
- Fibonacci Extensions: Use Fibonacci extensions (127.2%, 161.8%) to identify potential profit targets.
- Recent Swing Highs: Target the previous swing high or resistance level.
- Risk-Reward: Aim for a minimum risk-reward ratio of 1:2.
6. Hammer Candlestick Trading Checklist
Before entering a trade based on the hammer candlestick pattern, run through this static checklist to ensure you have covered all the key criteria.
| Step | Check | Status |
|---|---|---|
| 1 | Is there a clear downtrend (for hammer) or uptrend (for hanging man)? | ☑ Check |
| 2 | Does the candle have a small body and long lower wick (≥2x body)? | ☑ Check |
| 3 | Is the upper wick minimal or absent? | ☑ Check |
| 4 | Is there confirmation from RSI, MACD, or support/resistance levels? | ☑ Check |
| 5 | Is the risk-reward ratio at least 1:2? | ☑ Check |
| 6 | Have you set stop-loss below (hammer) or above (hanging man) the candle? | ☑ Check |
📌 Status indicates that each step should be verified before entering a trade. Missing any of these steps increases the risk of a losing trade.
7. How Reliable Is the Hammer Candlestick Pattern?
The reliability of the hammer candlestick pattern depends significantly on the timeframe, market context, and confirmation signals. Here are the key statistics:
- Success Rate: The hammer pattern has a success rate of approximately 62-76% depending on market conditions, timeframe, and confirmation signals.
- Higher Timeframes: The pattern is more reliable on daily, weekly, or 4-hour charts than on lower timeframes.
- Volume Confirmation: When confirmed by increasing volume, reliability increases significantly.
- Confirmation Candle: The pattern is most reliable when the next candle closes higher than the hammer’s close.
- Trend Context: The pattern is most reliable when it forms after a prolonged downtrend.
💡 Trading tip: Never rely solely on the hammer candlestick pattern. Always use it in combination with other technical tools such as RSI, MACD, and support/resistance levels.
8. Common Mistakes When Trading Hammer Patterns
Avoid these common pitfalls to improve your success rate with hammer candlestick patterns.
- ❌ Trading the pattern in isolation: Hammer patterns require confirmation from other technical indicators and oscillators.
- ❌ Ignoring the overall trend: The context is everything — a hammer in a downtrend is bullish, while a hammer in an uptrend is a hanging man (bearish).
- ❌ Entering too early: Entering before the pattern is confirmed (e.g., waiting for the next candle) can lead to losses.
- ❌ Placing stop-loss too tight: Setting the stop-loss too close to the entry can result in being stopped out by normal market noise.
- ❌ Ignoring the wick-to-body ratio: The lower wick must be at least twice the length of the body for a valid hammer.
- ❌ Confusing hammer with shooting star: A shooting star has a long upper wick and forms at the top of an uptrend (bearish). A hammer has a long lower wick and forms at the bottom of a downtrend (bullish).
9. Frequently Asked Questions
What is a hammer candlestick in an uptrend?
When a hammer-shaped candlestick appears in an uptrend, it is not called a hammer — it is called a Hanging Man. While the visual appearance is identical (small body, long lower wick), the context is different. A Hanging Man signals a potential bearish reversal at the end of an uptrend.
What is the difference between a hammer and a hanging man?
The difference is purely based on the market context. A hammer forms at the bottom of a downtrend and signals a bullish reversal. A hanging man forms at the top of an uptrend and signals a bearish reversal. Their visual appearance is identical.
How do you identify a hammer candlestick pattern?
Look for a small real body located at the upper end of the trading range, a long lower wick that is at least twice the length of the body, and little to no upper wick. The pattern must appear after a downtrend for a bullish signal.
How reliable is the hammer candlestick pattern?
The hammer pattern has a success rate of approximately 62-76% depending on market conditions, timeframe, and confirmation signals. When confirmed by volume or RSI, reliability increases significantly.
What is the best way to trade a hammer candlestick?
Identify the pattern in a downtrend, wait for confirmation (next candle closes higher), enter on a break above the hammer’s high, place stop-loss below the hammer’s low, and set take-profit using Fibonacci extensions or recent swing highs.
What is an inverted hammer candlestick?
An inverted hammer is a bullish reversal pattern that forms during a downtrend. It has a long upper wick, a small real body with little to no lower wick. It indicates that buyers pushed prices higher before sellers brought them back down.
Can the hammer pattern be used in forex trading?
Yes, the hammer pattern is widely used in forex trading and works on any timeframe, though it is most reliable on daily and 4-hour charts.
What confirmation signals work best with the hammer?
Common confirmation signals include RSI oversold conditions, support levels, bullish divergence, and the next candle closing above the hammer’s high.
What is the success rate of the hammer pattern?
Research shows the hammer pattern has a success rate of approximately 62-76% when filtered by volume or confirmed by additional indicators.
📊 Master another powerful bearish reversal pattern: Learn how to trade the Dark Cloud Cover candlestick — a complete trading guide. This bearish reversal pattern complements the hammer and hanging man by providing additional confirmation signals when trading reversals in uptrends.
📈 Understand the bigger market structure: Discover the Elliott Wave Zigzag pattern — 5-3-5 structure explained. Combining candlestick patterns like the hammer with Elliott Wave theory gives you a complete technical analysis framework for identifying reversals and trends.
📞 Need help with your hammer candlestick trading strategy? Our team is here to assist you. Visit our Contact Page or use the online chat available on every page of our website for immediate support.



 Signal2forex.com - Best Forex robots and signals


