

📑 Table of Contents
- 1. What Is the Harami Candlestick Pattern?
- 2. Types of Harami Patterns
- 3. How to Identify a Harami Pattern
- 4. Harami Trading Strategies
- 5. Bullish Harami vs Bearish Harami
- 6. Harami vs Engulfing — What’s the Difference?
- 7. Success Rate and Reliability of the Harami Pattern
- 8. Common Mistakes to Avoid
- 9. Frequently Asked Questions
1. What Is the Harami Candlestick Pattern?
The Harami (Japanese for “pregnant”) is a two‑candle reversal pattern where the second candle is completely contained within the body of the first. The pattern looks like a pregnant woman — the small candle appears to be “inside” the larger one, hence the name.
The Harami is one of the most widely recognised candlestick reversal patterns. Unlike single‑candle patterns like the hammer or shooting star, the Harami requires two candles to form, providing a more reliable signal of potential trend reversal.
There are two main variants of the Harami pattern:
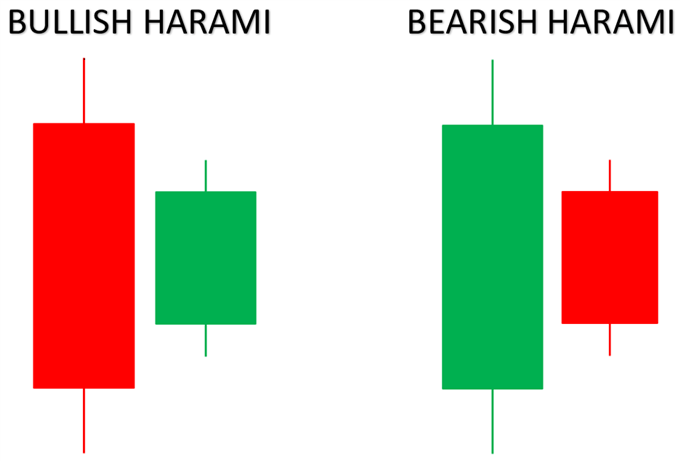
- Bullish Harami (Harami de Alta): Forms at the end of a downtrend — a large red candle followed by a small green candle contained within the first.
- Bearish Harami (Harami de Baixa): Forms at the end of an uptrend — a large green candle followed by a small red candle contained within the first.
2. Types of Harami Patterns
There are three primary types of Harami patterns that traders should be aware of:
Bullish Harami (Harami de Alta)
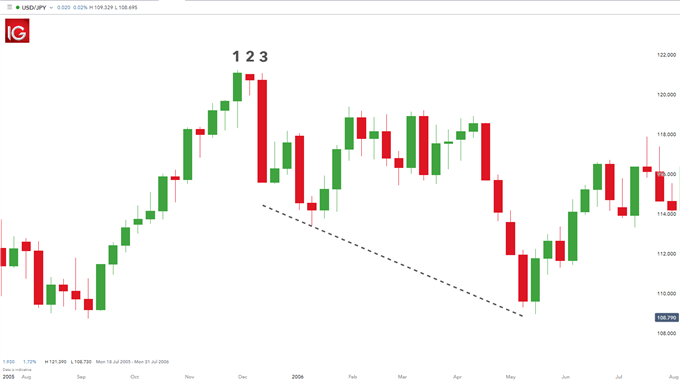
A bullish Harami appears at the bottom of a downtrend. The first candle is a large red (bearish) candle, indicating strong selling pressure. The second candle is a small green (bullish) candle that is completely contained within the body of the first. This pattern suggests that selling pressure is weakening and buyers may be starting to step in, signalling a potential reversal to the upside.
Bearish Harami (Harami de Baixa)
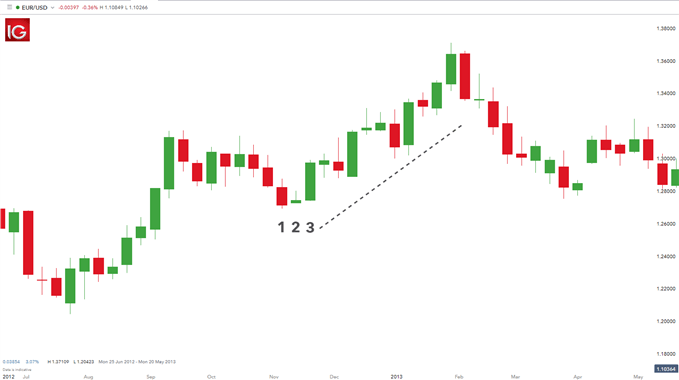
A bearish Harami appears at the top of an uptrend. The first candle is a large green (bullish) candle, indicating strong buying pressure. The second candle is a small red (bearish) candle that is completely contained within the body of the first. This pattern suggests that buying pressure is weakening and sellers may be starting to gain control, signalling a potential reversal to the downside.
Harami Cross
A Harami Cross is a variation where the second candle is a Doji (a candle with a very small body, indicating indecision). This is considered a stronger signal of a potential reversal because the Doji represents extreme indecision in the market. When a Doji appears inside the body of a large candle, it suggests that the market is unsure of the next direction, often preceding a significant reversal.
3. How to Identify a Harami Pattern
Identifying a valid Harami pattern requires attention to detail and context. Here are the key characteristics to look for:
Key Characteristics
- Two Candles: The pattern consists of exactly two candles.
- Large First Candle: The first candle must have a large real body, indicating strong momentum in the current direction.
- Small Second Candle: The second candle must have a small real body, indicating a slowdown in momentum.
- Containment: The second candle’s body must be completely contained within the body of the first candle.
- Location: The pattern must appear at the end of a clear trend — bullish Harami at the bottom of a downtrend, bearish Harami at the top of an uptrend.
Rules for Identification
- Confirm the Trend: Ensure the market is in a clear uptrend (for bearish Harami) or downtrend (for bullish Harami).
- Check Candle Size: The first candle should be significantly larger than the second.
- Verify Containment: The high and low of the second candle must be within the high and low of the first candle.
- Wait for Confirmation: Always wait for the next candle to confirm the reversal before entering a trade.
4. Harami Trading Strategies
Once you have identified a valid Harami pattern with confirmation, you can execute a trade using a structured approach. Here are the most effective strategies for trading the Harami pattern.
Confirmation Strategy
This is the most conservative and reliable approach. Wait for the third candle to confirm the reversal:
- Bullish Harami: Wait for the next candle to close higher than the Harami’s high. Enter on the open of the following candle.
- Bearish Harami: Wait for the next candle to close lower than the Harami’s low. Enter on the open of the following candle.
This strategy significantly increases the probability of a successful trade.
Breakout Strategy
For traders seeking earlier entry, the breakout strategy offers a more aggressive approach:
- Bullish Harami: Enter when price breaks above the high of the Harami pattern (the first candle’s high).
- Bearish Harami: Enter when price breaks below the low of the Harami pattern (the first candle’s low).
Combining with Other Indicators
The Harami pattern becomes more powerful when combined with other technical tools:
- Harami + RSI: Look for bullish divergence on RSI for a bullish Harami, or bearish divergence for a bearish Harami.
- Harami + Support/Resistance: The pattern is more reliable when it forms at a key support or resistance level.
- Harami + Moving Averages: Use moving averages to confirm the trend direction and identify potential entry points.
Stop-Loss and Profit Targets
- Stop-Loss: Place your stop-loss just below the low of the Harami pattern (for bullish) or just above the high (for bearish).
- Profit Target: Set your initial target at the most recent swing high (for bullish) or swing low (for bearish). Consider using ATR-based targets for volatility-adjusted profit taking.
5. Bullish Harami vs Bearish Harami
The table below compares the two main variants of the Harami pattern side‑by‑side.
| Feature | Bullish Harami (Harami de Alta) | Bearish Harami (Harami de Baixa) |
|---|---|---|
| Location | End of a downtrend | End of an uptrend |
| First Candle | Large red (bearish) | Large green (bullish) |
| Second Candle | Small green (bullish) — inside first | Small red (bearish) — inside first |
| Signal | Potential reversal to upside | Potential reversal to downside |
| Psychology | Selling pressure weakening | Buying pressure weakening |
| Confirmation | Next candle closes higher | Next candle closes lower |
| Reliability | 55–65% | 55–65% |
📌 Both patterns have similar reliability when traded with proper confirmation. The key is identifying the correct trend context.
6. Harami vs Engulfing — What’s the Difference?
Both the Harami and Engulfing patterns are two‑candle reversal patterns, but they have opposite structures. Understanding the difference is essential for accurate pattern recognition.
| Feature | Harami | Engulfing |
|---|---|---|
| Number of Candles | 2 | 2 |
| Second Candle Size | Smaller than first | Larger than first |
| Second Candle Position | Completely inside first | Completely covers first |
| Signal Strength | Moderate (earlier signal) | Stronger (later signal) |
| Reliability | 55–65% | 80–84% |
| Best For | Early reversal detection | Confirmed reversal trading |
📌 The Engulfing pattern is considered a stronger signal because the second candle completely covers the first, indicating a more decisive shift in momentum. However, the Harami often provides earlier entry opportunities.
7. Success Rate and Reliability of the Harami Pattern
The Harami pattern has a success rate of approximately 55–65% in the expected direction when traded with proper confirmation and risk management. However, this figure varies based on several factors.
Key factors that influence the success rate:
- Confirmation: Patterns with a strong confirming candle have a significantly higher success rate. Waiting for the third candle to confirm can increase accuracy to 65–70%.
- Timeframe: Higher timeframes (daily, weekly) produce more reliable signals. Lower timeframes produce more signals but with lower reliability.
- Market Context: Patterns at key support/resistance levels or with bullish/bearish divergence are more reliable.
- Harami Cross: The Harami Cross (second candle is a Doji) is considered more reliable than a standard Harami, as the Doji represents extreme indecision.
- Volume: Increased volume on the confirming candle adds credibility to the signal.
The Harami is generally considered a moderate‑reliability pattern — less reliable than the Engulfing pattern (80–84%) but more reliable than single‑candle patterns like the hammer or shooting star (45–55%). Its main advantage is that it provides earlier reversal signals than the Engulfing pattern.
8. Common Mistakes to Avoid
Even experienced traders make mistakes when trading the Harami pattern. Here are the most common pitfalls and how to avoid them.
- Trading Without Confirmation: The Harami is a warning signal, not a trade signal. Always wait for the next candle to confirm the reversal before entering.
- Ignoring the Trend: The Harami must appear at the end of a clear trend. A Harami in a ranging market is meaningless.
- Using the Wrong Timeframe: Lower timeframes produce many false signals. Stick to 4‑hour, daily, or higher timeframes for reliable signals.
- Confusing with Other Patterns: The Harami can be confused with the Engulfing pattern. Remember: in a Harami, the second candle is smaller and inside the first; in an Engulfing pattern, the second candle is larger and covers the first.
- Placing Stops Too Tight: Placing your stop-loss too close to the pattern increases the risk of being stopped out by normal market noise.
- Overlooking Volume: Low volume on the confirmation candle suggests weak conviction. Look for increased volume to validate the signal.
9. Frequently Asked Questions
What is a Harami candlestick pattern?
The Harami is a two‑candle reversal pattern where the second candle is completely contained within the body of the first. The name comes from Japanese meaning “pregnant,” as the small candle appears to be inside the larger one.
What is a bullish Harami?
A bullish Harami is a reversal pattern that appears at the end of a downtrend. It consists of a large red candle followed by a small green candle completely inside the first, signalling that selling pressure is weakening.
What is a bearish Harami?
A bearish Harami is a reversal pattern that appears at the end of an uptrend. It consists of a large green candle followed by a small red candle completely inside the first, signalling that buying pressure is weakening.
What is the success rate of the Harami pattern?
The Harami pattern has a success rate of approximately 55–65% in the expected direction. It is considered less reliable than the Engulfing pattern but offers earlier reversal signals.
Do I need confirmation for a Harami pattern?
Yes. Always wait for the next candle to confirm the reversal before entering a trade. Confirmation significantly increases the probability of a successful trade.
What is the difference between Harami and Engulfing?
In a Harami, the second candle is smaller and inside the first. In an Engulfing pattern, the second candle is larger and completely covers the first. Engulfing is considered a stronger signal with an 80–84% success rate.
What is a Harami Cross?
A Harami Cross is a variation where the second candle is a Doji (very small body). This indicates strong indecision in the market and can precede significant reversals. It is considered more reliable than a standard Harami.
Which timeframe works best for Harami patterns?
Higher timeframes (daily, weekly) provide more reliable signals. Lower timeframes produce more signals but with lower reliability. Swing traders typically use 4‑hour and daily charts.
Can Harami patterns be used in all markets?
Yes, the Harami pattern can be applied to any market — forex, stocks, commodities, and cryptocurrencies. It is a universal pattern that works across all asset classes.
What is the psychology behind the Harami pattern?
The Harami reflects a slowdown in momentum. After a strong move in one direction, the market takes a “pause” as the small candle forms. This pause suggests that the dominant force (buyers or sellers) is losing control, potentially leading to a reversal.
O que é o padrão Harami?
O Harami é um padrão de reversão de duas velas onde a segunda vela está completamente contida dentro do corpo da primeira. O nome vem do japonês e significa “grávida”, pois a vela pequena parece estar dentro da vela maior.
O que é um Harami de alta?
Um Harami de alta é um padrão de reversão que aparece no final de uma tendência de baixa. Consiste em uma vela vermelha grande seguida por uma vela verde pequena completamente dentro da primeira, sinalizando que a pressão de venda está enfraquecendo.
O que é um Harami de baixa?
Um Harami de baixa é um padrão de reversão que aparece no final de uma tendência de alta. Consiste em uma vela verde grande seguida por uma vela vermelha pequena completamente dentro da primeira, sinalizando que a pressão de compra está enfraquecendo.
📊 Understanding Market Psychology: While candlestick patterns like the Harami reveal market sentiment on a technical level, understanding the broader economic context is equally important. Read our analysis of Lloyd Blankfein’s views on the economy and Goldman Sachs’ outlook — a valuable perspective on how institutional sentiment aligns with the reversal signals you see on your charts.
📈 Master Complementary Patterns: The Harami is an excellent reversal pattern, but knowing when the market is consolidating before a breakout is equally important. Enhance your technical analysis with our comprehensive guide to using rectangle patterns to trade breakouts — learn how to identify consolidation zones and combine them with reversal signals like the Harami for higher‑probability entries.



 Signal2forex.com - Best Forex robots and signals


