
📑 Table of Contents
- 1. What Are Bollinger Band Reversal Patterns?
- 2. The Two Key Reversal Patterns: W Bottom and M Top
- 3. How to Identify a Bollinger Band Reversal Pattern — Step by Step
- 4. Bollinger Band Squeeze vs. Reversal Pattern — What’s the Difference?
- 5. Confirmation Indicators for Bollinger Band Reversals
- 6. Bollinger Band Reversal Trading Strategy — Step by Step
- 7. How Reliable Are Bollinger Band Reversal Patterns?
- 8. Common Mistakes When Trading Bollinger Band Reversals
- 9. Frequently Asked Questions
1. What Are Bollinger Band Reversal Patterns?
A Bollinger Band reversal pattern is a technical setup where price touches one of the outer bands (upper or lower) and then reverses direction. The most common formations are the W bottom (bullish) and M top (bearish) patterns.
Bollinger Bands, developed by John Bollinger, consist of a middle band (typically a 20-period simple moving average) and two outer bands set at two standard deviations above and below the middle band. When price reaches the outer bands, it is considered extended, and a reversal may be imminent.
These patterns are particularly effective because they combine mean reversion with momentum analysis. When price touches the lower band, it is statistically cheap, while touching the upper band indicates it is expensive. The W and M patterns provide specific entry and exit rules that help traders capitalise on these reversal opportunities.
2. The Two Key Reversal Patterns: W Bottom and M Top
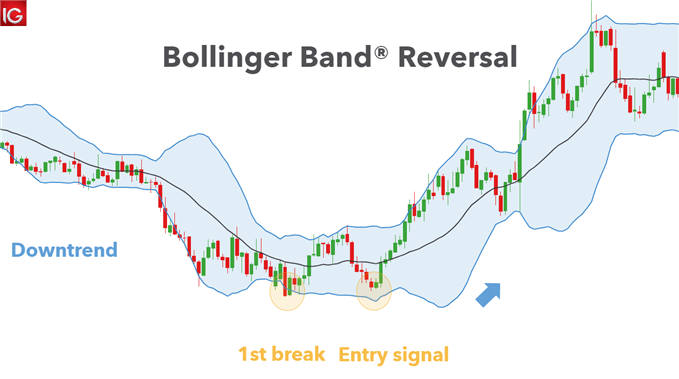
Understanding the differences between the W bottom and M top patterns is essential for developing effective trading strategies. The table below provides a clear comparison.
| Feature | W Bottom Pattern (Bullish) | M Top Pattern (Bearish) |
|---|---|---|
| Trend Before Pattern | Downtrend | Uptrend |
| First Touch | Lower band broken | Upper band broken |
| Second Touch | Fails to reach lower band | Fails to reach upper band |
| Formation | Double bottom (‘W’) | Double top (‘M’) |
| Signal | Bullish reversal | Bearish reversal |
| Entry | Break above neckline | Break below neckline |
| Stop-Loss | Below second bottom | Above second top |
| Take-Profit | Previous swing high | Previous swing low |
| Success Rate | ~60–70% | ~60–70% |
📌 Success Rate is based on historical performance when confirmed with additional indicators. Higher timeframes (daily, 4-hour) offer better reliability.
3. How to Identify a Bollinger Band Reversal Pattern — Step by Step
Identifying a Bollinger Band reversal pattern requires a systematic approach. Follow these five steps to spot valid setups.
Step 1 — Identify the Preceding Trend
Before looking for a reversal pattern, ensure there is a clear trend in place. For a W bottom, look for a downtrend with lower lows and lower highs. For an M top, look for an uptrend with higher highs and higher lows.
Step 2 — Add Bollinger Bands (20, 2)
Apply Bollinger Bands with the standard settings: a 20-period simple moving average and bands set at two standard deviations. These settings are widely used and provide reliable signals.
Step 3 — Look for the First Touch of the Band
In a W bottom, price breaks below the lower band, indicating selling pressure. In an M top, price breaks above the upper band, indicating buying pressure.
Step 4 — Look for the Second Touch That Fails to Reach the Band
After a pullback, price makes a second attempt in the same direction but fails to reach the outer band. This is the key divergence that signals the reversal. In a W bottom, the second low is higher than the first and stays above the lower band. In an M top, the second high is lower than the first and stays below the upper band.
Step 5 — Enter on the Break of the Neckline
The pattern is confirmed when price breaks the neckline — the high point between the two bottoms (W) or the low point between the two tops (M). This breakout provides the entry signal.
💡 Trading tip: The neckline is the critical level that confirms the pattern. A break above the neckline in a W bottom confirms the bullish reversal, while a break below the neckline in an M top confirms the bearish reversal.
4. Bollinger Band Squeeze vs. Reversal Pattern — What’s the Difference?
It is important to distinguish between a Bollinger Band squeeze and a reversal pattern, as they signal different market conditions.
Bollinger Band Squeeze: This occurs when the Bollinger Bands contract significantly, indicating a period of low volatility. A squeeze often precedes a sharp price move, but the direction of the breakout is unknown. Traders watch for a squeeze to anticipate a breakout, but they do not know whether it will be up or down.
Bollinger Band Reversal Pattern: This occurs when price touches an outer band and reverses direction, indicating a potential trend change. Unlike a squeeze, a reversal pattern provides a clear directional signal — either bullish (W bottom) or bearish (M top).
The key difference is that a squeeze signals low volatility and an impending breakout, while a reversal pattern signals a trend change after price has reached an extreme level.
5. Confirmation Indicators for Bollinger Band Reversals
Using confirmation indicators significantly improves the reliability of Bollinger Band reversal patterns. The table below provides a quick reference for the most effective confirmation tools.
| Indicator | Bullish Confirmation | Bearish Confirmation |
|---|---|---|
| RSI | Oversold (<30) + bullish divergence | Overbought (>70) + bearish divergence |
| MACD | Bullish crossover (above signal line) | Bearish crossover (below signal line) |
| Volume | Increasing on breakout | Increasing on breakdown |
| Price Action | Bullish engulfing, hammer | Bearish engulfing, shooting star |
📌 Bullish Confirmation indicates conditions that support a long trade. Bearish Confirmation indicates conditions that support a short trade. Always look for at least two confirmation signals before entering.
💡 Trading tip: RSI divergence is one of the most powerful confirmation signals. When price makes a lower low but RSI makes a higher low, it suggests weakening downside momentum and increases the probability of a bullish reversal.
6. Bollinger Band Reversal Trading Strategy — Step by Step
Trading Bollinger Band reversal patterns requires a disciplined approach. Follow these steps to maximise your chances of success.
Entry Rules
- W Bottom (Bullish): Enter a long position when price breaks above the neckline (the high between the two bottoms).
- M Top (Bearish): Enter a short position when price breaks below the neckline (the low between the two tops).
- Confirmation: Wait for the next candle to close in the direction of the breakout for additional confirmation.
- Alternative Entry: Some traders enter on the retest of the neckline after the breakout.
Stop-Loss Placement
- W Bottom: Place stop-loss below the second bottom (the second low of the W).
- M Top: Place stop-loss above the second top (the second high of the M).
- Buffer: Add a small buffer beyond the extreme to account for market noise.
- Risk Management: Never risk more than 1–2% of your trading account on a single trade.
Take-Profit Targets
- W Bottom: Target the previous swing high or use Fibonacci extensions (127.2%, 161.8%).
- M Top: Target the previous swing low or use Fibonacci extensions.
- Risk-Reward: Aim for a minimum risk-reward ratio of 1:2.
Real Trading Example (with Numbers)
Scenario: EUR/USD has been in a downtrend, making lower lows. Price breaks below the lower Bollinger Band at 1.0500, pulls back to 1.0600, and then makes a second low at 1.0520 — failing to reach the lower band (now at 1.0480).
Trade Setup (W Bottom):
- Neckline: The high between the two bottoms is at 1.0600.
- Entry: Buy at 1.0610 (above the neckline).
- Stop-Loss: Place stop-loss below the second bottom at 1.0500 (risk = 110 pips).
- Take-Profit: Target the previous swing high at 1.0750 (reward = 140 pips).
- Risk-Reward Ratio: 110 pips risk vs. 140 pips reward = approximately 1:1.27.
In this example, the trade reaches the target of 1.0750, delivering a profit of 140 pips with a well-defined risk-reward ratio.
7. How Reliable Are Bollinger Band Reversal Patterns?
Bollinger Band reversal patterns have a success rate of approximately 60–70% when confirmed with additional indicators like RSI or MACD. However, the reliability depends on several factors.
Factors That Increase Reliability:
- Higher Timeframes: The pattern is more reliable on daily, weekly, or 4-hour charts than on lower timeframes.
- Volume Confirmation: Increasing volume on the breakout strengthens the signal.
- Trend Context: The pattern is most reliable when it forms after a prolonged trend with clear extremes.
- Divergence: RSI or MACD divergence at the second touch significantly increases the probability of a reversal.
- Support/Resistance: The pattern is stronger when it forms at a key support or resistance level.
💡 Trading tip: Never rely solely on the Bollinger Band reversal pattern. Always use it in combination with other technical tools such as RSI, MACD, and support/resistance levels.
8. Common Mistakes When Trading Bollinger Band Reversals
Avoid these common pitfalls to improve your success rate with Bollinger Band reversal patterns.
- ❌ Trading the pattern in isolation: Bollinger Band reversals require confirmation from other indicators like RSI or MACD.
- ❌ Ignoring the overall trend: Reversal patterns are most reliable when they form after a prolonged trend. Trading against a dominant trend can be risky.
- ❌ Entering too early: Entering before the neckline is broken can lead to losses if the pattern fails.
- ❌ Placing stop-loss too tight: Setting the stop-loss too close to the entry can result in being stopped out by normal market noise.
- ❌ Ignoring volume: Low volume on the breakout reduces the reliability of the signal.
- ❌ Confusing a squeeze with a reversal: A squeeze signals low volatility and an impending breakout, not a reversal. Wait for clear directional confirmation.
9. Frequently Asked Questions
What is a Bollinger Band reversal pattern?
A Bollinger Band reversal pattern is a technical setup where price touches one of the outer bands and then reverses direction. The most common formations are the W bottom (bullish) and M top (bearish) patterns.
What is the W bottom pattern in Bollinger Bands?
The W bottom is a bullish reversal pattern that forms during a downtrend. Price breaks below the lower Bollinger Band, pulls back, and then makes a second low that fails to reach the lower band, forming a ‘W’ shape.
What is the M top pattern in Bollinger Bands?
The M top is a bearish reversal pattern that forms during an uptrend. Price breaks above the upper Bollinger Band, pulls back, and then makes a second high that fails to reach the upper band, forming an ‘M’ shape.
How do you trade a Bollinger Band reversal pattern?
Identify the pattern (W or M), wait for price to break the neckline, enter in the direction of the break, place stop-loss beyond the second extreme, and set take-profit at the previous swing high/low or Fibonacci levels.
What is the difference between a Bollinger Band squeeze and a reversal?
A squeeze occurs when Bollinger Bands contract, indicating low volatility and an impending breakout. A reversal pattern occurs when price touches a band and reverses direction, indicating a potential trend change.
What confirmation indicators work best with Bollinger Band reversals?
RSI (oversold/overbought with divergence), MACD (crossover signals), and volume analysis (increasing on breakout) are the most effective confirmation tools.
How reliable are Bollinger Band reversal patterns?
Bollinger Band reversal patterns have a success rate of approximately 60–70% when confirmed with additional indicators like RSI or MACD. Higher timeframes (daily, 4-hour) offer better reliability.
Can Bollinger Band reversal patterns be used in forex trading?
Yes, Bollinger Band reversal patterns are widely used in forex trading and work on any timeframe, though they are most reliable on higher timeframes like daily or 4-hour charts.
📊 Expand your pattern recognition skills: Discover the top 10 candlestick patterns every trader must know — from Doji and Hammer to Evening Star and Bullish Harami. Mastering these patterns alongside Bollinger Band reversals gives you a complete technical analysis toolkit.
🏦 Understand the bigger picture: Learn how central bank intervention in the foreign exchange market can trigger sudden reversals — essential knowledge for identifying when a Bollinger Band reversal pattern is being influenced by major institutional players.
📞 Need help with your Bollinger Band trading strategy? Our team is here to assist you. Visit our Contact Page or use the online chat available on every page of our website for immediate support.



 Signal2forex.com - Best Forex robots and signals


